Aluminum oxide ceramics possess characteristics such as high mechanical strength, high hardness, good high-temperature insulation performance, and corrosion resistance. They are widely used in fields such as machinery, electronics, and chemical engineering.
However, the high melting point of aluminum oxide also results in a high sintering temperature. Therefore, additives are often used to lower the sintering temperature of aluminum oxide ceramics. Additionally, the sintering temperature of aluminum oxide ceramics is directly proportional to its purity.
The sintering of aluminum oxide ceramics is mainly influenced by two factors:
1. The small atomic radius of aluminum oxide crystals and strong ionic bonds result in low diffusion, making sintering temperatures relatively high.
2. During the later stages of sintering, there is significant influence on grain growth. At this stage, abnormal grain growth may occur, leading to uneven structures and even large internal closed pores, reducing the bonding strength between grains and consequently lowering the material’s performance.
Currently, there are three main methods to reduce the sintering temperature of aluminum oxide:
1. Reducing the particle size of aluminum oxide powder.
2. Employing other advanced sintering techniques.
3. Adding sintering aids.
Sintering aids have become one of the best technologies for reducing the sintering temperature of aluminum oxide ceramics due to their simple operation, low cost, and high efficiency. Through modified doping processes, it is also possible to significantly improve the electrical properties of aluminum oxide ceramics.
Sintering aids mainly form solid solutions with the aluminum oxide matrix. By increasing lattice distortion, they enhance diffusion rates and lower the sintering temperature of aluminum oxide ceramics.
Common additives of this kind include MnO2, TiO2, Fe2O3, etc. They have similar lattice constants to aluminum oxide and can form different types of solid solutions with it. For instance, Fe2O3 and Cr2O3 can form infinite solid solutions with aluminum oxide, while MnO2 and TiO2 can form limited solid solutions. Moreover, many of these additives contain variable valence elements, which enhance lattice distortion. This, in turn, promotes point diffusion or interface movement during sintering, facilitating lattice activation and improving the sintering performance of the matrix.
Additionally, these additives or the interaction between additives and the aluminum oxide matrix can form a liquid phase at high temperatures, promoting sintering through a dissolution-precipitation mechanism. The formation of a liquid phase is a primary factor in reducing the sintering temperature of aluminum oxide ceramics. These additives mainly consist of alkaline earth metal oxides such as CaO and MgO, with crystal structures mostly being cubic stacking. Due to their different crystal structures from the matrix, they are difficult to dissolve into the aluminum oxide lattice and tend to aggregate at grain boundaries in the form of impurities. When the sintering temperature reaches the melting point or eutectic temperature of the additive, a liquid phase begins to appear, facilitating the migration and diffusion of points in the sintered body, thereby improving the sintering performance of aluminum oxide ceramics. Introducing one or more of these additives into the matrix can form binary, ternary, or even more complex low-melting compounds, resulting in a stable liquid phase.
This study proposes to prepare CaMgSi2O6 and CaTiO3 with relatively low melting points using solid-phase and hydrothermal methods. These compounds will be combined in a 1:1 ratio and used as sintering aids for aluminum oxide ceramics. The research will investigate their effects on the sintering performance and strength of aluminum oxide ceramics.
1. Raw Materials and Experimental Methods
1.1 Preparation of CaMgSi2O6 and CaTiO3 by Solid-State Method
Chemically pure calcium carbonate, magnesium carbonate, and SiO2 reagents were accurately weighed in a molar ratio of 1:1:2. They were then placed in an agate jar and distilled water was added to fill 80% of the milling jar’s volume. The mixture was ground for 2 hours in a planetary ball mill. After milling, the sample was transferred to a crucible and dried at 120°C in a drying oven. The dried sample was sintered at 850°C for 1.5 hours in a box-type resistance furnace to obtain CaMgSi2O6 samples.
Chemically pure CaCO3 and TiO2 were accurately weighed in a molar ratio of 1:1 and placed in a milling jar. Wet milling was conducted by adding distilled water to fill 80% of the milling jar’s volume, and the mixture was milled for 2 hours. After milling, the sample was transferred to a crucible and dried at 120°C in a drying oven. The dried sample was sintered at 850°C for 1.5 hours in a box-type resistance furnace to obtain CaTiO3 samples.
1.2 Preparation of CaMgSi2O6 and CaTiO3 by Hydrothermal Method
Analytically pure magnesium chloride, calcium chloride, ethyl silicate, and other reagents were accurately weighed in a molar ratio of 1:1:2. An appropriate excess of urea and deionized water was added, and the mixture was stirred magnetically for 0.5 hours in a beaker. The resulting mixture was then transferred to a reaction kettle, with the volume of the reaction solution occupying 80% of the reaction kettle’s volume. After tightly sealing the reaction kettle lid, the mixture was reacted at 160°C for 12 hours. After completion of the reaction, the sample was washed and dried to obtain CaMgSi2O6 samples.
Analytically pure calcium chloride and titanium tetraisopropoxide were accurately weighed in a molar ratio of 1:1. An appropriate excess of urea and deionized water was added, and the mixture was stirred magnetically for 0.5 hours in a beaker. The subsequent steps for reaction temperature and time were consistent with those used for preparing CaMgSi2O6 samples by the hydrothermal method. After washing and drying, CaTiO3 samples were obtained.
1.3 Preparation of Low-Temperature Sintered Aluminum Oxide Ceramic Materials
The CaMgSi2O6 and CaTiO3 samples prepared by the solid-state method were mixed in a 1:1 ratio, referred to as additive a; the CaMgSi2O6 and CaTiO3 samples prepared by the liquid-phase method were also mixed in a 1:1 ratio, referred to as additive b. Using Al2O3 as the reference material, additives a or b were added in proportions of 8%, 10%, 12%, and 14% by mass. After molding, the powders were sintered at 1350°C for 6 hours to obtain Al2O3 ceramics.
1.4 Material Structure and Property Testing
The sintered Al2O3 ceramics were observed for their microstructure using a scanning electron microscope (SEM, Hitachi S-3400N). X-ray diffraction (XRD, Bruker D8 advance) was employed to study their phase composition. The hardness of the materials was measured using a digital Vickers hardness tester (HVS-50, Laizhou Huayin Testing Instrument Co., Ltd.), and the flexural strength of the materials was determined using a hydraulic universal testing machine (WE-100, Changchun Testing Instrument Co., Ltd.).
2. Results and Discussion
2.1 Analysis of Material Phase Composition
The X-ray diffraction (XRD) patterns of CaMgSi2O6 and CaTiO3 samples prepared by both solid-state and hydrothermal methods are shown in Figures 1 and 2, respectively.
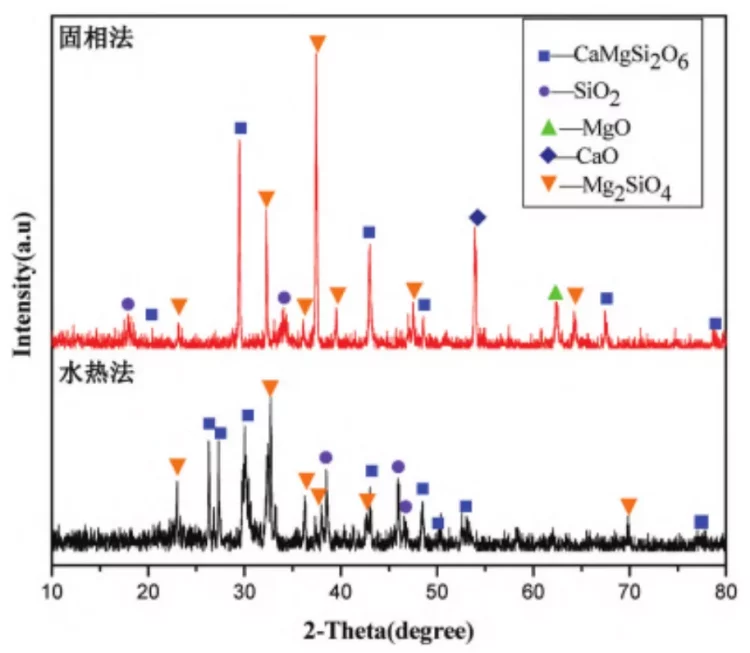
Figure 1: XRD patterns of CaMgSi0.0 products prepared by solid-phase and liquid-phase methods.
From Figure 1, it can be observed that in the samples prepared by the solid-state method, in addition to the desired product CaMgSi2O6, there are also residual SiO2 and decomposition products of CaCO3 and MgCO3, such as CaO and MgO. Additionally, there are intermediate products like Mg2SiO4 present. The peaks in the XRD patterns are tall and sharp, with narrow half-widths, indicating good crystallinity and relatively large grain size of the products.
In comparison, the XRD pattern of the products obtained by the liquid-phase method shows significant differences from those of the solid-state method. Besides containing the target product CaMgSi2O6, the liquid-phase method also retains some residual SiO2 and intermediate product Mg2SiO4, but residual MgO and CaO are barely detected in the XRD pattern. Moreover, in the XRD pattern of the products prepared by the liquid-phase method, the peaks exhibit a certain degree of broadening, with larger half-widths and smaller grain sizes.
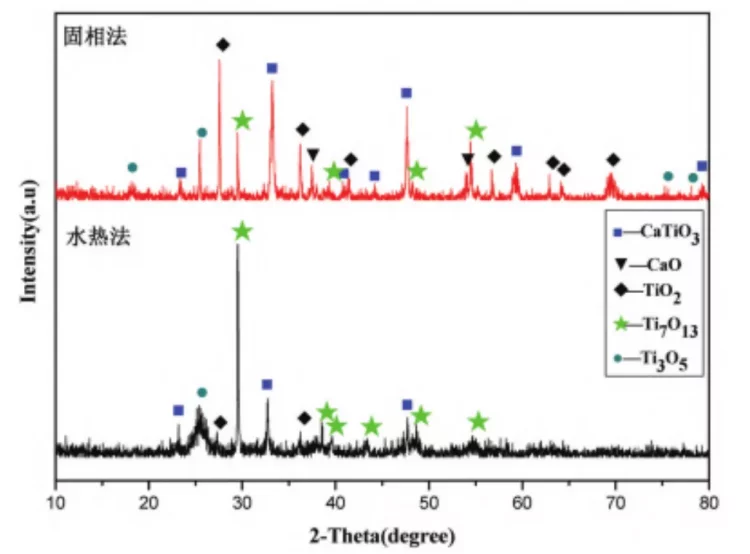
Figure 2 XRD patterns of CaTiO3 products prepared by solid-phase and liquid-phase methods.
From Figure 2, it can be seen that in the products prepared by the solid-state method, in addition to the target product CaTiO3, there are also significant amounts of CaO, TiO2, Ti3O5, Ti7O13, and other titanium oxides. The diffraction peaks in the XRD pattern are narrow, with small half-widths, indicating well-developed crystals and high crystallinity of the compounds, with relatively large grain sizes.
In contrast, in the products prepared by the liquid-phase method, besides CaTiO3, there are also certain amounts of titanium oxides present. However, the variety of titanium oxides is fewer compared to those obtained by the solid-state method. Additionally, there is a significant difference in the diffraction intensity of the Ti7O13 peak compared to the solid-state method, indicating that the preparation method has a significant influence on the crystal structure of the products.
2.2 Analysis of Material Microstructure
The morphology of the samples after sintering at 1350°C for 6 hours is shown in Figure 3. It can be observed from the figure that the type and amount of additives have no significant effect on the grain size of the samples, but they do have a noticeable impact on the density of the samples. Under the same conditions of additive dosage, the samples using additive b show significantly higher density compared to those using additive a. This difference is mainly attributed to the additives prepared by the hydrothermal method, which are nano-sized particles with higher surface energy, making them more prone to forming a liquid phase at high temperatures. Additionally, nano-sized particles have a larger surface area, leading to increased contact area with Al2O3 particles, thus enhancing the efficiency and rate of material migration during sintering, thereby significantly promoting the sintering process. In contrast, additives prepared by the solid-state method are micron-sized particles, larger than those prepared by the hydrothermal method. The contact area between particles is relatively smaller, making it more difficult to form a liquid phase compared to nano-sized particle additives at the same temperature.
Furthermore, from the figure, it can be seen that different additives have varying effects on the density of the samples. The density of samples using additive a increases first and then decreases with increasing additive dosage. When the additive dosage is 10% and 12%, the density is higher, but it decreases when the dosage is increased to 14%. In contrast, the density of samples using additive b increases with increasing additive dosage, and significant traces of liquid phase formation can be observed in the samples using additive b. The liquid phase binds the Al2O3 particles together, thereby increasing the density of the samples.

Figure 3: SEM image of the sample after sintering at 1350°C for 6 hours.
(Note: a: 8% additive, a, b: 8% additive b, c: 10% additive a, d: 10% additive b, e: 12% additive a, f: 12% additive b, g: 14% additive a, h: 14% additive b)
2.3 Analysis of Material Mechanical Properties
The relationship between the hardness of the alumina ceramics obtained after sintering at 1350°C for 6 hours and the usage of additives is shown in Figure 4. From Figure 4, it can be observed that the samples using additive b exhibit higher hardness compared to those using additive a, indicating that additive b has an advantage over additive a in improving the hardness of alumina ceramics. For the same sintering aid, with an increase in the usage of the sintering aid, the hardness of the alumina ceramics shows a trend of initially decreasing and then increasing. When the usage is 10%, the hardness is at its minimum, with a hardness of 403.1 MPa for samples using additive a and 575.2 MPa for samples using additive b.
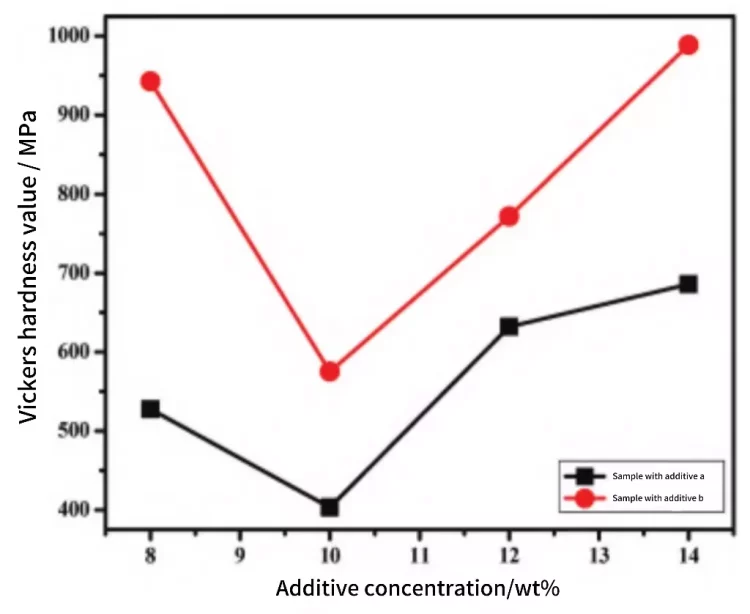
Figure 4 Relationship curve between additive concentration and Vickers hardness of Al2O3 ceramics.
After sintering at 1350°C for 6 hours, the flexural strength of alumina ceramics varies with the dosage of the sintering aid, as shown in Figure 5. From the graph, it can be seen that the samples using additive b generally exhibit higher flexural strength compared to those using additive a. The flexural strength of the samples corresponds to the analysis results of the sample’s cross-sectional structure, where samples using additive b generally have higher density compared to those using additive . The appearance of a liquid phase during sintering promotes the progress of the sintering process, enhances the migration and diffusion of substances in the samples, thereby strengthening the bonding strength between particles. For samples using the same type of additive, the flexural strength of alumina ceramics shows a trend of initially decreasing and then increasing with an increase in the dosage of the additive. When the usage is 12%, the flexural strength of the samples is at its minimum, with a flexural strength of 75.6 MPa for samples using additive a and 144.8 MPa for samples using additive b.
3.Conclusion
By analyzing the effect of sintering aids prepared by solid-state and hydrothermal methods on the sintering performance, hardness, and flexural strength of Al2O3 ceramics, the following conclusions can be drawn:
1. Under the same sintering conditions, the density of samples using additive a shows an initial increase followed by a decrease with increasing additive dosage. However, when the dosage reaches 14%, the density decreases. In contrast, the density of samples using additive b tends to increase with increasing additive dosage.
2. Under the same sintering conditions, both the hardness and flexural strength of the samples show a trend of initially decreasing and then increasing with increasing additive dosage. When the additive dosage is 10%, the hardness of the samples is the lowest, and when the dosage is 12%, the flexural strength of the samples is the lowest.